Introduction
Greatest challenge of current era is to meet the energy demand by providing the proper energy supply which is hampered by increasing oil shortage and rising pollution level due to excessive coal usage. Relying on the batteries is one of the best solutions to address the existing problems and to meet the growing energy demand. Materials plays a vital role in deciding the efficiency and lifespan of the manufactured batteries. Fundamental understanding of materials and its characterisation is very important in taking the technology forward in a quick phase. Though different techniques are available for the identification and characterization of battery materials, Raman spectroscopy is one of the quickest techniques among them. Also, it is essential to extract the data from the working electrodes in-situ to understand the interactions of materials which is possible by Raman Spectroscopy. The objective of the current study is the quick characterization of the battery materials used as electrodes, electrocatalysts and identification of number of layers of reduced graphene oxide (rGO) layers by mapping using Raman spectroscopy.

Materials and Methods
Raman Spectroscopy of the battery materials was performed using an IndiRAM CTR-500 Raman spectrometer, TechnoS Instruments Ltd., Jaipur, India. A laser excitation source of 532 nm emission wavelengths was used. Different industrial grade graphene samples, anode and electrocatalyst materials were characterized.
Results and discussion
Figure 1(a) shows the Raman spectra acquired from different industrial grade Graphene samples showing G and D band. Figure 1(b) shows the spectra of ZnTiO3, Sr2TiMnO6, and CaCu3Ti4O12 respectively. In ZnTiO3 spectrum, 311 and 446 cm-1 are due to the oxygen vibration of Zn–O–Zn, 610 cm-1 corresponds to vibrations of Ti–O–Ti[1]. Convoluted asymmetric peak around 500 cm-1 (475 and 523 cm-1) in Sr2TiMnO6 corresponds to the T2g vibration modes [2]. The Raman lines of CaCu3Ti4O12 at 446, 510 and 572 cm-1 correspond to Ag symmetry and Fg symmetry respectively [3]. Fig 1 (c) shows mapping of reduced GO in which layer numbers are directly related to the IG ratios and the corresponding intensities and peak positions are tabulated in
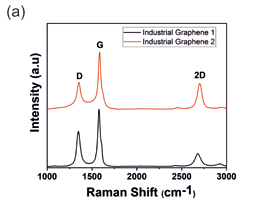
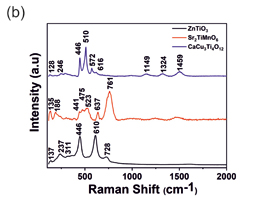
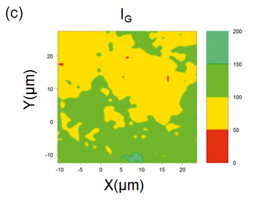
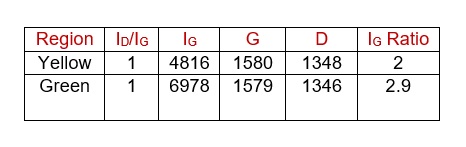
Fig.1 Raman Spectra of (a) Industrial Graphene Samples (b) different anode materials such as ZnTiO3, Sr2TiMnO6 and CaCu3Ti4O12 and (c) Raman mapping carbon black using Intensity of G peak
Table.1. Single spectra are extracted from different colored regions (which intensity are comparable since all the conditions are same), intensity of G peak is compared to find out the number of layers. G peak values are blue shifted from Graphite as result of functional groups as expected in Graphene oxide and D peak value are also closer to 1350 which is reported to be caused by mixed chains of hydroxyl and epoxy groups in GO. As we can see in the IG map bilayer (yellow) and tri layer (green) are majority of the sample.
Conclusion
In this application note, quick characterisation of battery materials has been carried out by Raman Spectroscopy.
Reference
[1] Arin, J., Thongtem, S., Phuruangrat, A. & Thongtem, T. Characterization of ZnO–TiO2 and zinc titanate nanoparticles synthesized by hydrothermal process. Research on Chemical Intermediates 43, 3183–3195 (2017).
[2] Murugesan, G., Nithya, R. & Kalainathan, S. Colossal dielectric behaviour of Sr2TiMnO6-δ single crystals. J Cryst Growth 530, (2020).
[3] Kolev, N. et al. Raman spectroscopy of (formula presented). Phys Rev B Condens Matter Mater Phys 66, 1–4 (2002).