Raman Imaging of Pharmaceutical API's distribution in a Tablet
Introduction
Active Pharmaceutical Ingredients (API) and excipients are blended to get the final product in the form of syrup, tablet, etc., Quality of the pharmaceutical product depends on the uniformity of the aforesaid components. It is essential to monitor the different stages of the manufacturing process in order to achieve the homogenous distribution. At present, an expensive, and destructive chromatography techniques have been carried out for the API detection [1]. Raman mapping is an alternate non-destructive, less expensive technique in which laser beam is rastered in the defined region of interest of the sample surface and the spectra from point to point are acquired sequentially. These spectra are post processed and reconstructed by the software to produce the mapping images. Mapping provides the spatial distribution and also the size of the constituents in a sample. In the current study, mapping has been carried out on the Ibugesic tablet to determine the distribution of API through univariant and multivariant techniques such as Principle Component Analysis (PCA) and Discriminant Canonical Analysis (DCA).
Materials and Methods
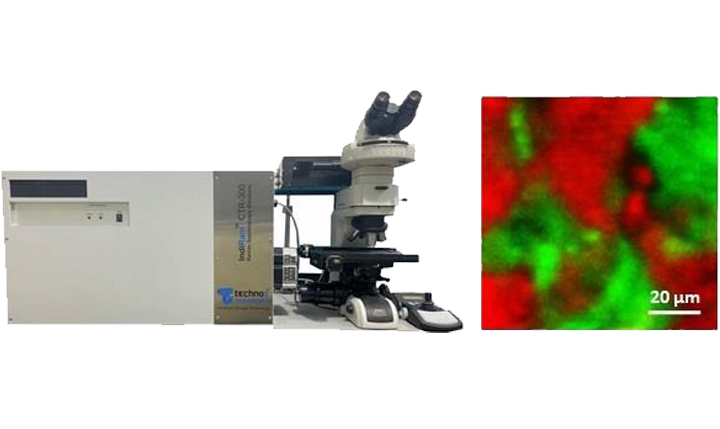
Raman mapping of the tablet was performed using an IndiRAM CTR-300C Raman spectrometer, TechnoS Instruments Ltd., Jaipur, India. A laser excitation source of 785 nm emission wavelengths was used with 100 mW power and the step size of 1 µm. The main ingredients are ibuprofen and paracetamol.
Results and Discussion
Figure 1 (a-b) shows the Raman spectra of Ibuprofen, Paracetamol API and Ibugesic tablet, (c-e) shows composite Raman mapping of Ibugesic obtained through univariant, PCA, and DCA, respectively. The fingerprints of both the API are observed in the Ibugesic spectrum. The maps contain 8281 individual spectra. In the univariant technique, map of the entire scan area of the sample is reconstructed by selecting the net count of peak specific to the corresponding API at every pixel. Selection of bands for Ibuprofen and Paracetamol are highlighted in red and green colour around 837 and 857 cm-1 respectively in fig. 1 (a) and the map reveals the distribution of both the API. The spectra in the different API domain match with the respective reference.
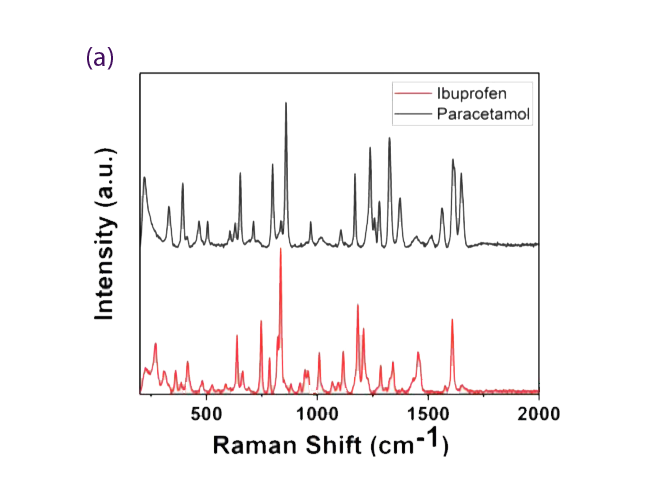
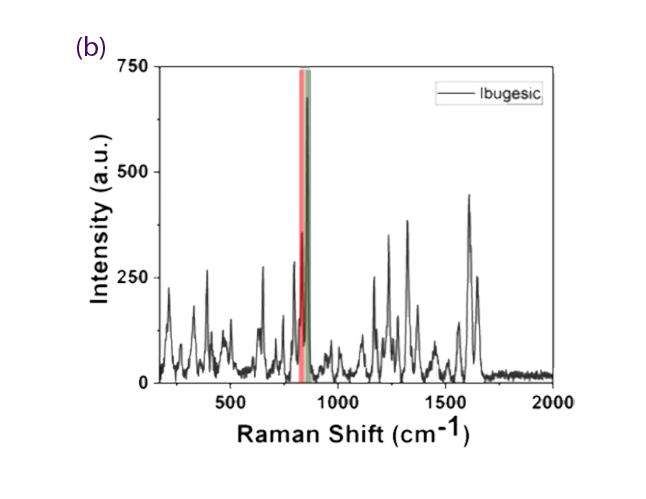
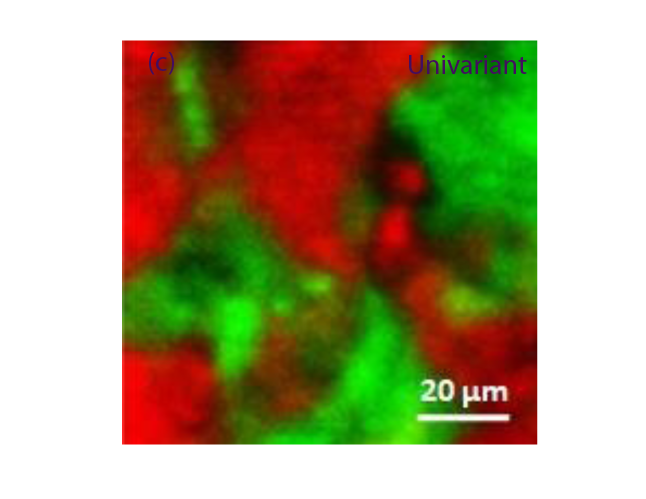
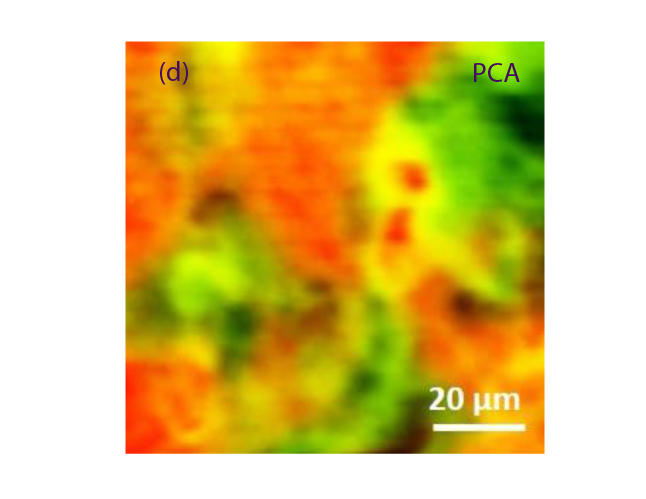
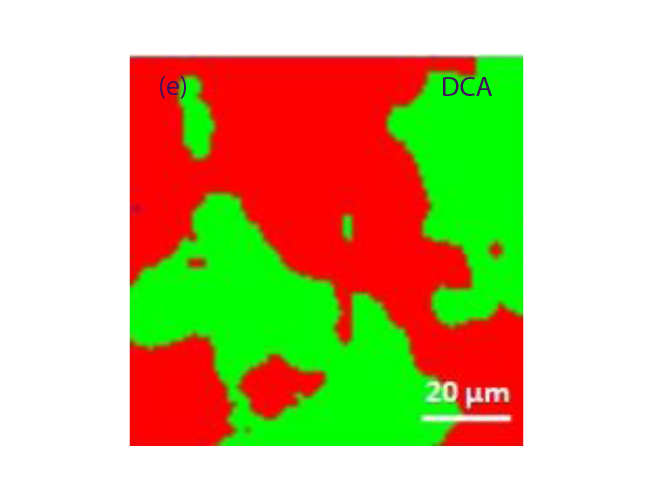
Fig.1 Raman mapping of a Ibugesic tablet sample measured at 785 nm (a-b) Raman spectra acquired from Ibuprofen, Paracetamol API and Ibugesic tablet (c-e) Composite Raman mapping of Ibugesic using univariant, multivariant technique such as PCA and DCA, respectively showing Ibuprofen (Red) and Paracetamol (Green)
Mapping results from multivariate technique such as PCA and DCA are showing similar distribution of API to that of univariant mapping. Multivariant are used in complex system where peak overlap is present whereas univariant gives concurrent result in case of partially overlapped spectra [2]. Thus, user has the option to go for individual selection of peak for the generation of specific component in the map through univariant and the all the components through multivariant which are highly advantageous.
Conclusion
In this application note, the distribution of API of tablets was studied by Raman mapping using Univariant and Multivariant techniques.
Reference
[1] Y.-L. Chew, M.-A. Khor, Y.-Y. Lim, Heliyon, 7 (2021) e06553.
[2] K.C. Gordon, C.M. McGoverin, International journal of pharmaceutics, 417 (2011) 151-162.